Hate Crimes
Since the Trump election, I’ve been concerned about what, concretely, a resurgence in racism might mean, and how likely it is. There are people I respect saying “anything could happen” and warning us to stay vigilant and prepared to resist acts of fascist tyranny. There are also people I respect telling everyone to calm down because it’s probably not that bad.
As a grandchild of a resistance fighter against the Nazis, I was raised to believe that it _can _happen here, and we have to be prepared. Part of preparation, though, is realism. What _exactly _are we facing, and what kind of preparation is appropriate? The first step is trying to assess the situation accurately.
It may seem naive to start by reviewing hate crime statistics. The numbers probably aren’t all that accurate; and recorded hate crimes are nowhere near all the harms due to racism. I’ll be making some attempts to deal with the first issue later in this post. As for the second, well, this is a very primitive attempt to come to my own conclusions. I would need to be an economist with far more resources and time, in order to, say, estimate the cumulative economic damage of redlining. For the moment, I want to do the exercise of looking at some numbers and coming to my own conclusions — not because I expect to do that _better _than social scientists do, but to practice original seeing, which I think is important for getting outside the sway of others’ opinions.
Why hate crime? Because racial violence is one of the concrete “bad outcomes” that we implicitly fear, when we fear a “rise in racism”. So it makes sense to ask things like how common it is now, and how common it was in the past, or how common it is in other countries, to get a sense of the _range _of where things can go.
Overview
There are two major data sources in the US for information on hate crimes. One is the Department of Justice’s National Crime Victimization Survey, which is taken from a sample of about 100,000 households, and asks them detailed questions about crimes they’ve been the victims of. The other is the FBI’s Uniform Crime Reporting database, which collects recorded crimes from police departments across the country. These sources conflict quite a bit.
The US only began recognizing “hate crime” as a legal category in the 90’s, so older information on hate crime is mostly unavailable. For (very rough) comparison purposes, I’m also going to look at statistics on lynching and on race riots, to get a sense of past levels of racial violence. I’ll also briefly compare these to contemporary Russian hate crime statistics, for an example of a country which famously has a severe problem with racial violence.
UCR Data
In 2015, there were 5850 hate crime incidents reported to the FBI by police departments.
Of these, 36% were motivated by anti-black bias, 13% by anti-gay (male) bias, 12% by anti-white bias, 12% by anti-Jewish bias, 5% by anti-Muslim bias, 4% by anti-LGBT bias excluding gay males, and 2% by anti-Hispanic bias.
(I was surprised to see so low a rate of hate crimes against Hispanics, and so high a rate against whites.)
There were 18 murders and 13 rapes. There were 4482 crimes against persons, of which 41.3% were intimidation, 37.8% assault, and 19.7% aggravated assault. (That is, a total of 2577 assaults.) The majority of the 2338 hate crimes directed against property were acts of vandalism.
The states with the highest number of hate crimes per capita were:
- DC
- Massachusetts
- North Dakota
- Montana
- Kentucky
Southern states in general have lower per-capita rates of hate crime than northern states, according to the UCR; and Mississippi has a grand total of _zero _hate crimes reported, which is highly suspicious. There is a serious underreporting problem with hate crimes — several major Southern cities never report hate crimes at all, such as Birmingham, Alabama; Jackson, Mississippi; and Baton Rouge, Louisiana. So it’s quite likely that these numbers are underestimates.
The UCR has been keeping hate crime stats since 1995. Hate crime rates have been slowly declining in that period. Anti-black hate crimes are about ⅔ their 90’s level, anti-Jewish hate crimes are about 60% of their 90’s level, anti-white hate crimes are about half, etc.
The number of anti-Muslim hate crimes spiked in 2001, from negligible to about 500, and then declined to a stable but higher-than-before level.
So, clearly, it is possible for current events to cause a spike in hate crimes. This is a special type of a spike in hate crimes, though: Muslims may have been so small and new a population in the US that they just weren’t a habitual target of bigotry before September 11. The September 11th hate crimes spike tells us that current events can rapidly create new targets of bigotry, even when they were largely left alone before.
NCVS Data
From 2004-2012, the rate of hate crime victimization in the population, according to the self-reports in the NCVS survey, remained steady at roughly 1 per 1000 persons 12 or older.
This would imply a much higher rate of hate crime than the UCR reports — roughly 260,000 a year — and even if we only count those crimes which survey respondents said they reported to police, that’s still 120,000. However, according to the NCVS, only 14,380 hate crimes were confirmed by police investigators. Most _reports _of hate crimes do not result in the police _concluding _there was a hate crime. And, of those, we might infer, only a fraction are reported to the UCR, given that the UCR’s hate crime numbers are less than half the number that the NCVS says were confirmed by police.
This low rate of police recording and police reporting is specific to hate crimes, not common across all crime. The UCR and NCVS also include reporting on non-hate crimes like rape, robbery, aggravated assault, etc. In most of these cases, the number of crimes that the NCVS says were reported to police is comparable to the number of crimes that the UCR says were recorded by police.
| Crime | # (NCVS 2012) | % reported to police (NCVS 2012) | # recorded by police (UCR 2012) | recording rate |
| Rape | 431840 | 32.5 | 90185 | 0.64 |
| Robbery | 578580 | 60.9 | 327374 | 0.93 |
| Aggravated assault | 816760 | 58.4 | 764449 | 1.6 |
| Simple assault | 3179440 | 40 | n/a | n/a |
| Burglary | 2904570 | 60 | 1579527 | 0.91 |
| Motor vehicle theft | 564160 | 83.3 | 707758 | 1.5 |
| Theft | 11142310 | 29 | 5706346 | 1.76 |
| All hate crime | 293790 | 34 | 6718 | 0.067 |
| Violent hate crime | 263540 | 34 | 4810 | 0.053 |
The one exception is hate crime, where only about 5% of hate crimes reported to police are recorded in the UCR.
That this discrepancy exists _specifically _in hate crimes suggests that police preferentially take hate crimes less seriously than other crimes. And, indeed, according to the NCVS, police were more likely to take reports and make arrests in non-hate crimes vs. hate crimes.
However, the fact that there are cases where the NCVS numbers significantly _undershoot _the UCR numbers — giving the nonsensical result that the police record more e.g. motor vehicle thefts than victims report to police — suggests that the NCVS may have some serious sampling bias.
In the NCVS 2012 data, 52% of hate crime victims were white, 13% were black, and 30% were Latino. This throws some doubt on the much lower rate of anti-Hispanic hate crimes in the UCR data — maybe Latinos/Hispanics are less likely to report hate crimes to the police, or less likely to be taken seriously by the police.
According to the NCVS, 16% of hate crimes were “serious violent crimes” (robbery, aggravated assault, or rape), 44% were “simple assault”, and 22% were property crime.
So How Many Hate Crimes Are There?
The unfortunate fact is that we don’t know how many hate crimes there are, because both our major data sources seem to have serious flaws.
How big a deal is hate crime, in terms of damage to human life? What are the casualty rates?
According to the NCVS, 5% of hate crimes were aggravated assault causing injury, and 10.6% were simple assault causing injury, giving roughly 32,760 injuries a year due to hate crime.
The NCVS doesn’t report murders. The UCR’s numbers of 18 hate-crime murders a year are probably an underestimate, but also probably not as much of an underestimate as the other types of crime, since I would expect that people are more likely to report murders to the police than other crimes. There were a total of 15,809 homicides in the US in 2011. If 0.1% of all crimes are hate crimes, as the NCVS reports, and homicide is a representative crime, then this would predict 15 hate-crime homicides a year, which is comparable to the UCR’s numbers.
My tentative order-of-magnitude estimates are that there are 10-20 hate-crime murders a year, and tens of thousands of hate-crime injuries.
Lynchings
According to the Tuskeegee Institute archives, lynchings in 1882-1968 were at most one or two hundred killings a year.
At the peak in 1892, the total number of lynchings in the US was 230, with 161 blacks and 61 whites killed.
Controlling for population growth, and comparing lynchings of black people directly to all hate-crime murders, (yes, obviously this is an imperfect comparison), this means that “hate-crime killings” were roughly 45x as common per population in the late 19th century as they are today.
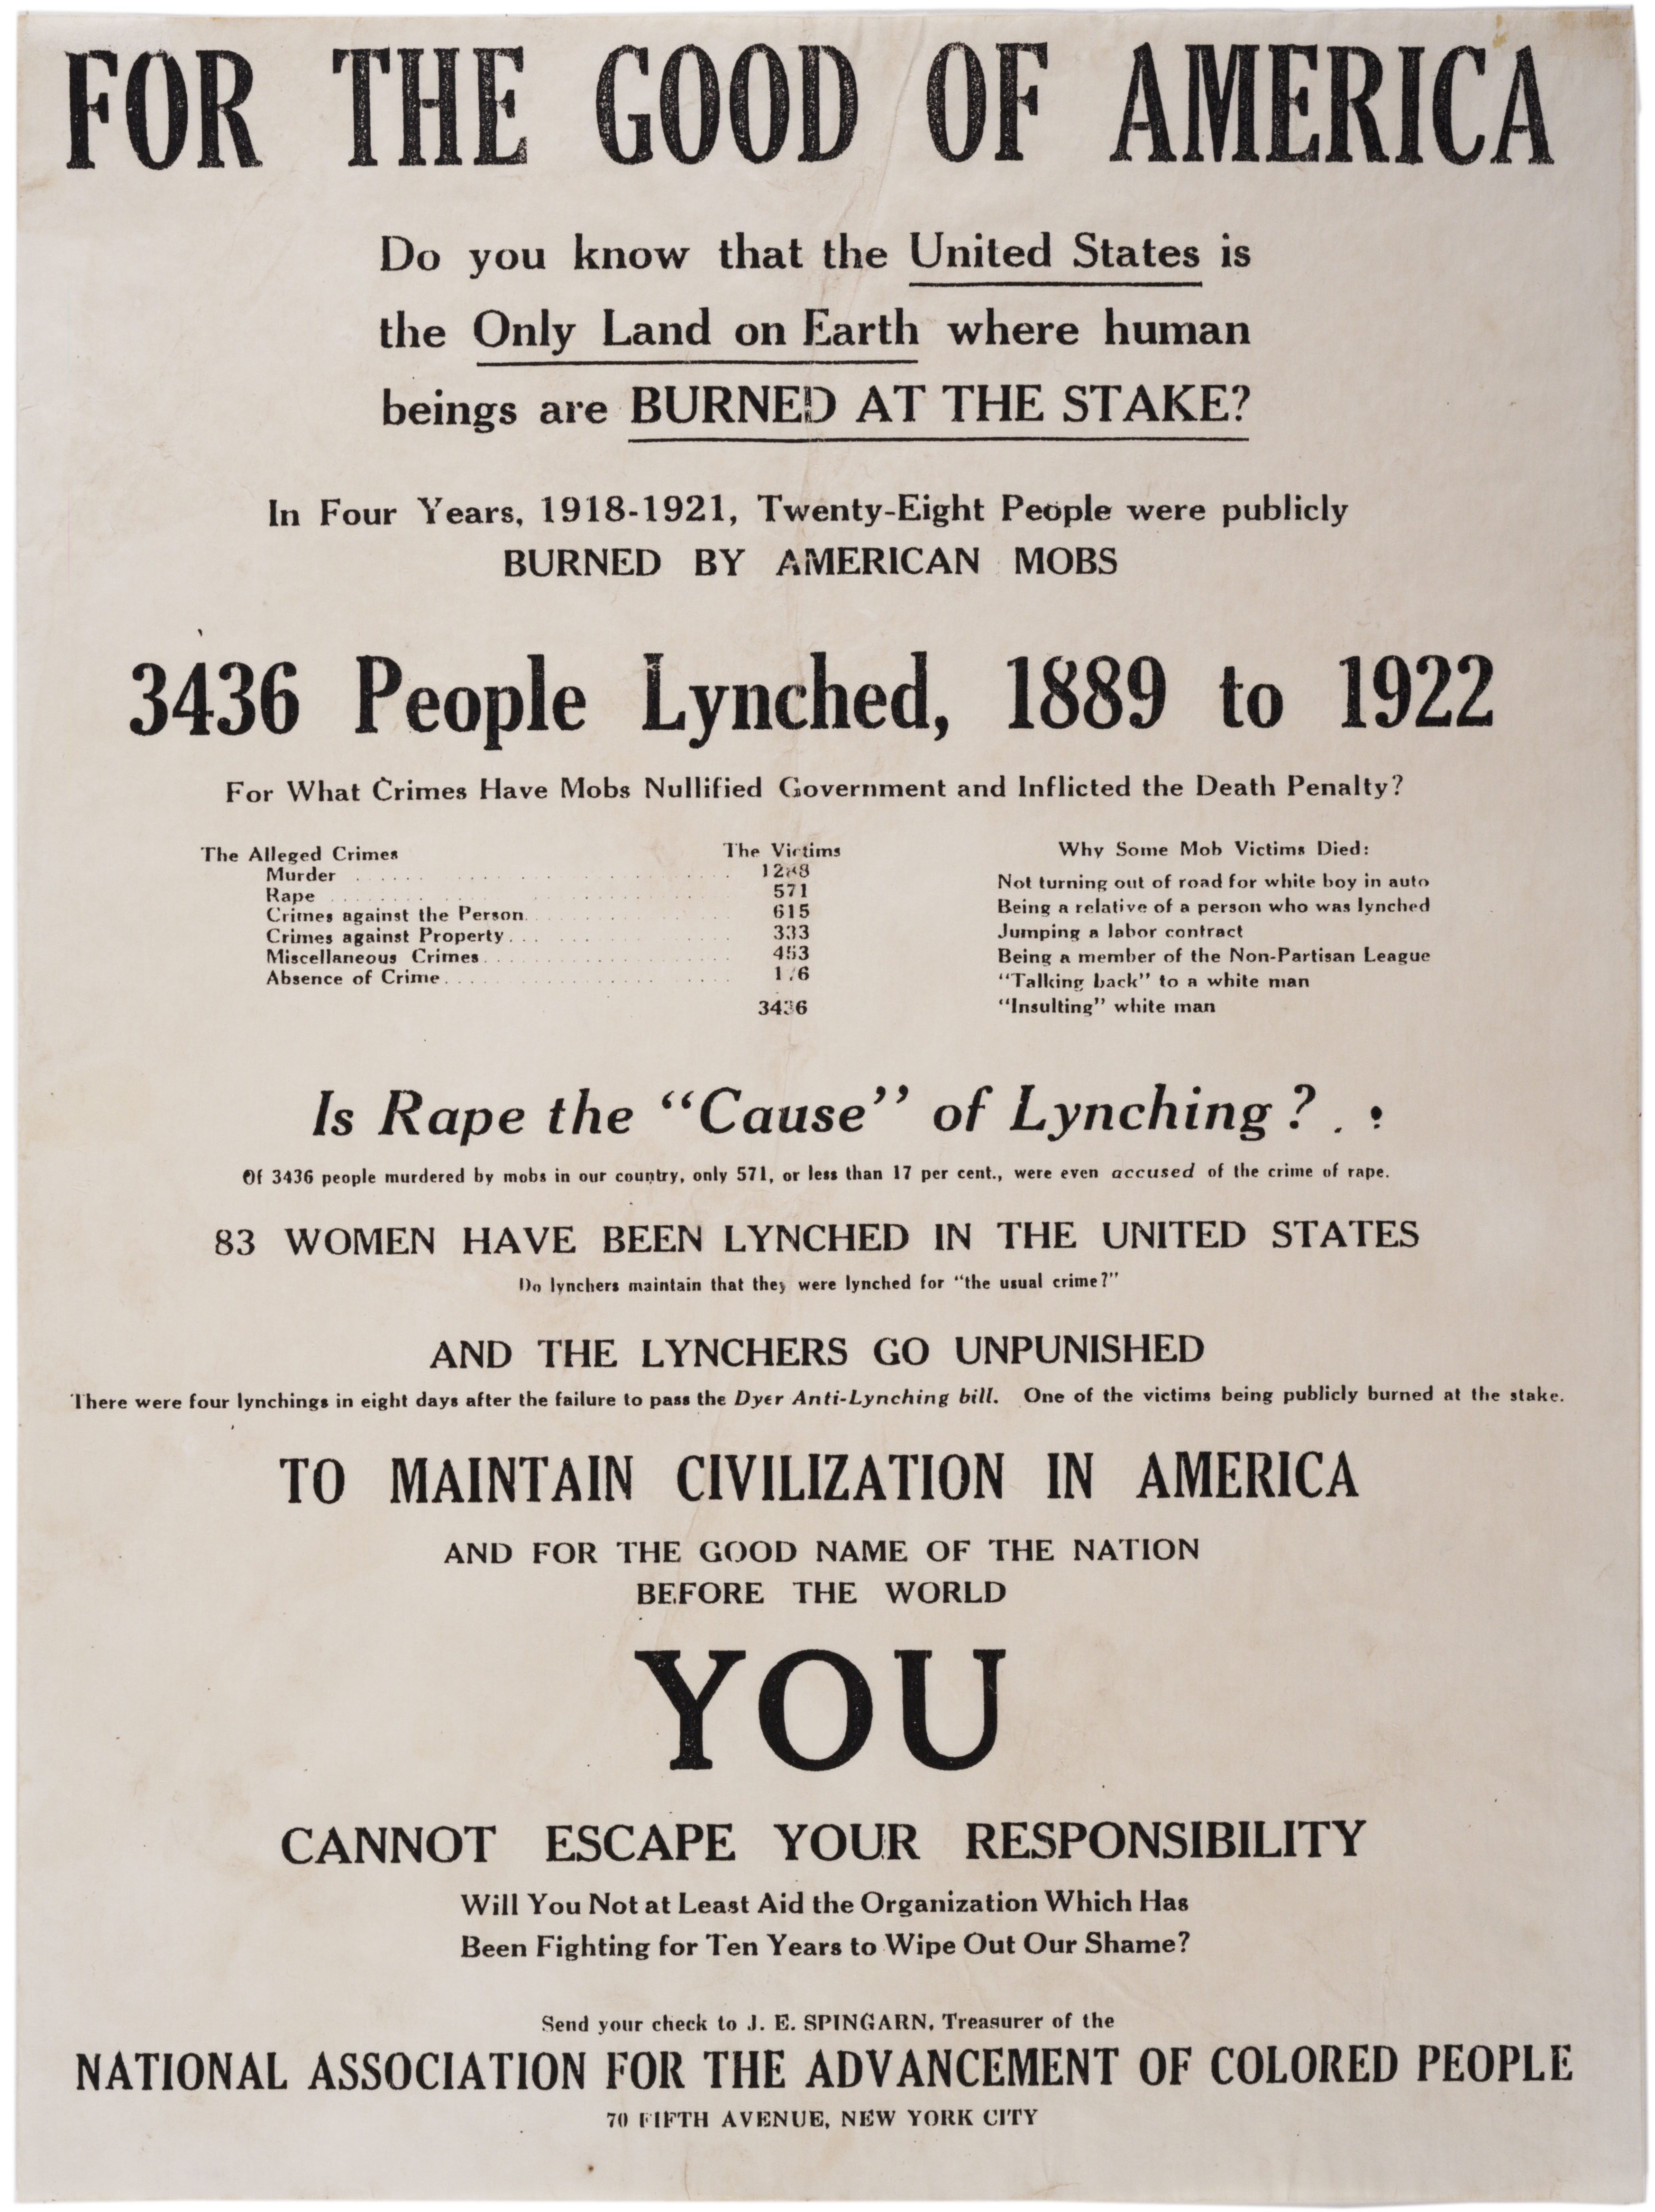
The NAACP numbers claim there were 3436 people lynched between 1889 and 1922, or an average of 104 lynchings per year.
Lynchings began to decline in the 1920’s, potentially due to a variety of causes: the urbanization of the South, more active anti-lynching efforts by state police and the National Guard, the activism of the NAACP, and the attempt to pass the Dyer Anti-Lynching Bill in 1922. (It passed in the House but failed in the Senate.)
It’s worth noting that this is what a climate of lawless terror looks like.
**_It wasn’t that black people had to use a separate drinking fountain or couldn’t sit at lunch counters, or had to sit in the back of the bus._**


_You really must disabuse yourself of this idea. Lunch counters and buses were crucial symbolic planes of struggle that the civil rights movement used to dramatize the issue, but the main suffering in the south did not come from our inability to drink from the same fountain, ride in the front of the bus or eat lunch at Woolworth’s._


_It was that white people, mostly white men, **occasionally went berserk, and grabbed random black people, usually men, and lynched them**. You all know about lynching. But you may forget or not know that white people also randomly beat black people, and the black people could not fight back, for fear of even worse punishment._


_This constant low level dread of atavistic violence is what kept the system running. It made life miserable, stressful and terrifying for black people._


_White people also occasionally tried black people, especially black men, for crimes for which they could not conceivably be guilty. With the willing participation of white women, they often accused black men of “assault,” which could be anything from rape to not taking off one’s hat, to “reckless eyeballing.”_


_This is going to sound awful and perhaps a stain on my late father’s memory, but when I was little, before the civil rights movement, my father taught me many, many humiliating practices in order to prevent the random, terroristic, berserk behavior of white people. The one I remember most is that when walking down the street in New York City side by side, hand in hand with my hero-father, if a white woman approached on the same sidewalk, I was to take off my hat and walk behind my father, because he had been taught in the south that black males for some reason were supposed to walk single file in the presence of any white lady._


_This was just one of many humiliating practices we were taught to prevent white people from going berserk._


_I remember a huge family reunion one August with my aunts and uncles and cousins gathered around my grandparents’ vast breakfast table laden with food from the farm, and the state troopers drove up to the house with a car full of rifles and shotguns, and everyone went kind of weirdly blank. They put on the masks that black people used back then to not provoke white berserkness. My strong, valiant, self-educated, articulate uncles, whom I adored, became shuffling, Step-N-Fetchits to avoid provoking the white men. Fortunately the troopers were only looking for an escaped convict. Afterward, the women, my aunts, were furious at the humiliating performance of the men, and said so, something that even a child could understand._


_This is the climate of fear that Dr. King ended._
To get _that _experience, you only need a few dozen actual recorded lynchings per year. The indirect impact of living under threat of violence far exceeds the literal death count.
This is what it looks like, historically, to have 45x the rate of racial violence of today.
Race Riots
For most of US history before the 1960’s, a “race riot” was racial violence by white people against nonwhite people (usually black, sometimes immigrants such as Filipinos or Mexicans). Whole towns might be attacked and burned. In the early 20th century, these were extremely bloody: in the Tulsa race riot of 1921, whites literally bombed a black neighborhood from private airplanes, killing about 300 and forcing thousands from their homes.
While lynchings were largely a rural Southern activity, race riots were urban and nationwide.
There is no central repository of race riot casualty statistics that I could find, so I have some quick-and-dirty Internet numbers here; this is not an exhaustive list.
- 1898 Wilmington, 18 black deaths
- 1906 Atlanta, 25-100 black deaths
- 1917 East St. Louis, 40-200 black deaths, plus arson; 6000 fled the city
- 1919 “Red Summer”: roughly 310 deaths
- 1920 Ocoee: 50-60 deaths
- 1921 Tulsa: 300 dead, more than 800 hospitalized
- 1923 Rosewood: 8-150 deaths
- 1930 Watsonville: 12 severe injuries, one death
- 1935 Harlem: 3 dead, hundreds wounded
- 1943 Detroit: 34 deaths, 344 wounded; Harlem 6 deaths; Zoot Suit Riots, no deaths but many injuries
- 1963 Birmingham: 50 wounded;
- 1964 Rochester: 4 dead, 350 injured; Harlem 1 dead, 118 injured; Philadelphia 344 injured
- 1965 Watts 34 dead
- 1966 Hough 4 deaths, 50 injuries
- 1967 Newark 26 deaths, hundreds of injuries, Plainfield one death, Detroit 43 dead, 1189 injured, Milwaukee 4 deaths, 100 injuries
- 1968 King assassination riots: 43+ deaths, 2500+ injuries
- 1969 York one death, 60+ injuries.
A return to the levels of racial violence of the 1910’s-1920’s would mean, relative to population, roughly a 50x increase in the number of “hate crime” murders compared to today. As with lynching, this is what a climate of terror looks like.
A return to the levels of racial violence of the 1960’s would constitute a roughly 5x jump, compared to the number of hate crime homicides of today. That’s what it looks like to live in what we now remember as a “turbulent” time.
Pre-1963, only 10% of race riots could be attributed to escalation by blacks. Afterwards, most race riots were still started by whites but the proportion became closer to 60/40.
Mass racial violence dissipated through the 70’s and never again reached its 60s peak, with a few exceptions such as the Rodney King riots of 1992, which killed 50 people and caused $1B in property damage.
Hate crimes in Russia
There are estimated tens of thousands of neo-Nazi skinheads in Russia. In 2008, Amnesty International estimated 85,000 neo-Nazis in Russia. Over the past ten years, there are an average of 56 hate-crime-related deaths a year, and 378 injuries. Source, from SOVA, a Russian think tank that studies racism and xenophobia in Russia.
Racism in Russia is most commonly directed against Africans, Central Asians, Jews, and Vietnamese. Only a few percent of the Russian population are peoples of the Caucasus, and there are only 186,000 Jews in Russia, so this is a much more intensive campaign of violence than it would be in the US; the US is about 23% nonwhite; so, conservatively, accounting for Russia’s lower total population and lower non-Russian population than the US, racial violence in Russia is maybe 31x as deadly, in terms of risk of being victimized, as it is in the US.
Once again, this is what a climate of fear and widespread mob violence looks like. Dozens of hate-crime murders per year, more than an order of magnitude more common than hate-crime murder is in the US.
(Anti-LGBT violence is also a serious problem in Russia but we don’t seem to have good statistics on how common it is; one report says 300 attacks per year.)
Did hate crimes in the US increase post-election?
UCR and NCVS numbers come out yearly, so it’s clearly too soon to tell from those sources.
There’s allegedly a 30% jump in NYC hate crimes this year, and the NYPD has instituted a special police unit to fight the uptick.
The SPLC has set up an opportunity for people to report hate crime incidents around the election, but all those they cited were “intimidation” — verbal harassment and threats. The most common type was anti-immigrant intimidation. The most common locations were schools.
Another tracking site for hate crimes reports 79 self-reported incidents of “violence”, but I noted several errors (duplicates, shootings that were apparently non-hate-related, non-violent crimes).
I think that it’s important to be watchful to see if a post-election rise in hate crimes holds up, but we don’t have enough evidence to be confident that there’s been one.
Scenario Planning
The “really bad” scenario for hate crime in the US is a rise of 30-50x in serious mob violence motivated by bigotry and tacitly condoned by the state. This, we know from historical and international evidence, feels from the inside like living in a dangerous, lawless, oppressive place.
I do not think mob violence alone will cause genocide on a much larger scale. The twenty million murders committed by the Nazis are a different, alien, unthinkable scale of operation. I suspect you need governments for that. Governments that actively want to exterminate a population, not just keep it fearful and subordinate. Mob violence is much more common than official campaigns of extermination, and is a more likely threat scenario.
One good thing is that it’s probably not possible to jump to 1890’s-1920’s levels of racial mob violence all at once. If that were to happen, we’d see a smaller uptick before it gets that bad. If we’re watchful, we’ll have warning, and we may be able to counteract the problem.
The SPLC has advice on how to prevent hate crime. I’m not sure how well validated this is, but what they emphasize is community response. Churches and town councils can organize things like prayer meetings, candlelight vigils, public gatherings with marches and speeches, and other public, communal displays of support for the victims of hate crimes and refusal to tolerate hate in the community. Forming “coalitions for tolerance” to protest hate crimes and support victims of hate can send a forceful message to hate groups that they are not welcome, and potentially prevent future crimes.
I don’t know much about this topic, but I’d probably want to read more on the psychology and dynamics of mob violence, and whether there are known techniques for defusing or preventing it. I’d very much appreciate if more knowledgeable people shared info about this.